Target Group Survey: Setup & Evaluation
- The Letter Team

- Jun 26, 2019
- 7 min read
To substantiate and refine our choices for myENSCHEDE, we conducted a user survey in the streets of Enschede and online. Half of the survey was done in Enschede's street, but the second half was carried out online, as the project got more stressful and we did not have the time to go to the city centre in person anymore on market days. In this blog posts, the results of the survey are presented and the choices we derived from the results are explained. In total, 23 people responded to our survey.
Socio-Demographic Data
The first question we asked our respondents was their gender. More than two-thirds of our survey respondents are female. This is not really representative of our target group, because we aimed to include men and women equally.

However, the fact that more women have participated in our survey as compared to men is a first indicator for us that our idea attracts more women. This is good, because the way we imagine the installation come to life (flowers, mandala designs etc.) is not exactly a "manly" design.
The next thing we wanted to know was the age distribution of the target group. We wanted to make sure that our survey respondents fit into our target group of 18-30 years.

With the exception of one outlier at 37, all survey respondents are between 18 and 30 years. Almost all ages are represented, and despite the peaks in the early 20s, there are also some respondents in the late 20s, which is good, as it makes the results more representative of the entire target group.
Regarding the countries/cities of origin, we had a lot of responses from several countries. Our goal was to ask as few people from Enschede as possible, because we target visitors, not residents.

The origins can be summed up as follows:
The Netherlands (not Enschede): 12 respondents
Enschede: 1 respondent
Germany: 4 respondents
Other European countries: 6 respondents
Our main focus is on German and Dutch visitors who are, with 16 out of 23 respondents, well represented in our sample.
About Enschede
The next section of our survey is about Enschede and people's opinions about the city. This topic is really relevant to us because it defines what draws people to the city, what they like, dislike and what they would like to know more about. Based on the data we retrieve from these answers, we can refine the concept of our installation.
The first question we asked was the reason for people's last visit to Enschede. We asked an open question here, because we wanted to get an unbiased response from people and know about the first thing that came to their minds. As opposed to asking a closed question that gives people the option to choose between pre-defined answers, an open question is much more neutral and investigative.

People were last in Enschede for the following reasons:
Studying: 8 respondents
Shopping: 7 respondents
Working: 4 respondents
Strolling through the city: 2 respondents
Day trip: 2 respondents
Smoking weed: 1 respondent
Visiting friends: 1 respondent
The large share of students can be explained by the fact that we shared the survey with a few friends and acquantainces, most of whom are also students. As expected, shopping also makes up for a large share of the motivation to go to Enschede. It is also interesting that people come for day trips, or simply because they want to walk around. Apparently, Enschede is considered just a beautiful place by some visitors.
From our perspective, these findings are in line with what we already learned from our client, Enschede Promotie. We think that our installation should serve to make people aware of other things besides shopping in Enschede, because the city has so much more to offer, and only few people seem to appreciate it yet.
Next, we asked people how they inform themselves about Enschede. We wanted to find out which information channels our target group uses, so that we can address them exactly there.

To our surprise, Facebook is used by many more respondents than Instagram. Perhaps, Instagram's information sources are just not that well-known or Facebook's more text-based format is appreciated more for informational purposes. 5 respondents also inform themselves via uitinenschede.nl, which is not so many, especially given the fact that the website is really good and you can find a lot of things there. Maybe the website is just not attractive enough for visitors. A large share of the respondents also simply use Google. What we foud interesting is that one respondent indicated Trip Advisor: An obvious information source that we had not thought about yet. This inspired us to look for good places in Enschede on Trip Advisor, when we searched information for our own website.
With our website, we will have some kind of coverage in the Google search results, although we don't do SEO. If we had a bit more time for this project, SEO would definitely be a recommendable step for us to take because Google is one of the main sources of information. The above results also reinforce our intuitive decision to use Facebook and Instagram as our media for promoting myENSCHEDE: We are on the right track regarding promotional channels!
As the next result shows, people are pretty positive about Enschede:

No one has anything negative to say about it. Some people seem to be a bit indifferent about it but most respondents think that Enschede is a good place to be. We cannot exclude a little social desirability bias here because the respondents knew that our project is tied to Enschede. But in general, the results seem credible.
Of course, it was interesting for us to know why respondents rated Enschede so positively.


Their answers included a few key aspects:
There is a nice atmosphere in the city. The city is beautiful and it is nice to be there.
People were, on the other hand, a bit undecided about whether the city really offers a lot of things to do or not.
The city is small, everything is within reach.
Enschede has nice shops.
We then asked people another open question - about their favourite thing in Enschede. We already asked them what draws them to Enschede in one of the other questions, but many of them just come out of obligations (e.g. study, work). Now we want to know how we can motivate people to come to Enschede in their free time:

To sum it up, the most named favourite things about Enschede are:
The city centre (Oude Markt, Van Heekplein): 5 respondents
Shopping: 8 respondents
Festivals/events: 6 respondents
With the city centre, respondents also associated nice bars, friendly people and a relaxed atmosphere. We now found out something that had not been named before: Enschede has a great social side to it. You can meet a lot of nice people and join lots of cool events - there is something to do for everyone.
Most respondents seem to be hungry for more information about Enschede, as the next results show:

While we as a team know that there is already more than enough information about Enschede, our target group either does not seem to know or does not like using the channels that are already there. As a conclusion, we can draw that the information about Enschede needs to be presented in a more accessible and attractive way to this target group.
Since we already had the meaning of the ENSCHEDE letters in mind, we wanted to verify if we were on the right track with the attractions of Enschede that we had chosen:

To our great surprise, even more people seem to be interested in events than in shopping. On the second place is shopping. Then, surprisingly many people are also interested in nature. Also, restaurants play a large role. The nightlife and the activities are only favoured by a few people. We think that most visitors want to come to Enschede during the day instead of at night, and that they would rather visit the city than spend the time with some (indoor) activities. Nevertheless, these two aspects also play a role.
Our Concept
Last but not least, we wanted to verify our concept with this survey. The installation itself and the mobile website that users can access via the QR codes. Therefore, we presented the installation to our respondents and asked them what they thought about it, and why.
Regarding the mobile website, respondents' answers were mixed.

Generally, people seem to want to give our mobile website/app a try, but some of them are not really interested or would not use it.

Respondents said that a mobile app could be a good way to have all information in one place and discover things that you don't know yet. On the other hand, some people want to inform themselves in advance, already know their favourite places or prefer not to rely on an app but discover the city themselves.
For the installation, the responses look like this:
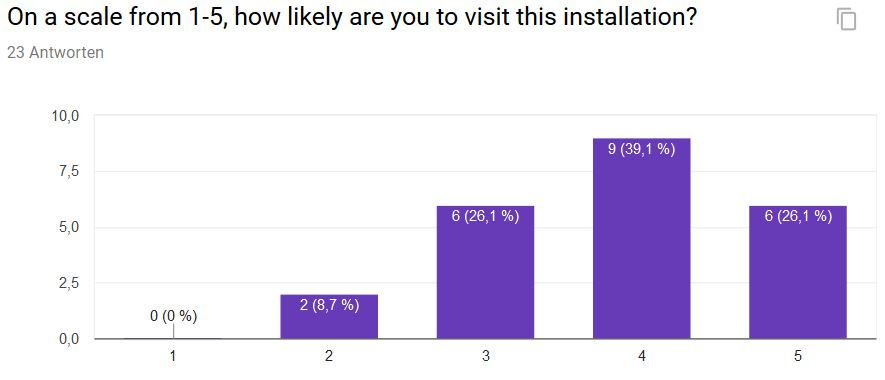
As you can see, the responses are right-skewed, but again, we assume a certain bias in the responses because no one would openly answer that they think our installation is a bad idea. We also wanted to know the reasons for people's answers:


Various reasons were given for people's willingness to visit the installation or the lack thereof. Mainly, people said that they liked the idea, were curious about the end result and the interaction, but many of them simply cannot be there on a weekday. Either because they are busy with other things or they will not be in Enschede during these days. We can only wait and see how many visitors will come eventually, but we are happy about the positive feedback. No one said that he/she was not really convinced of the installation and was just not interested.
Summary
We asked 23 people about Enschede and our concept, two-thirds of whom are female and almost all of whom are in our target group from 18-30. The majority of our respondents are not from Enschede, although some of them live here for study or work.
The main reasons for our respondents to come to Enschede are study, work and shopping. Mostly, it is rather for obligations than for leisure that people come to Enschede.
Facebook, Instagram and Google are the main information sources for Enschede's visitors.
Generally, our respondents like Enschede, mainly for its atmosphere, shops and the accessibility of everything in the city centre.
Respondents' favourite things in Enschede are the city centre, the events and shopping.
Our respondents would like more information about Enschede.
They are interested most in events, shopping, food and nature.
Respondents would use both our website and installation but they are more excited about the installation.
We can therefore conclude that there needs to be more information about Enschede's attractions apart from shopping, which our installation is going to offer. With our social media that we chose, Facebook and Instagram, we are on the right track to offer them. What we should focus more on is that our installation transports the unique atmosphere to Enschede that so many respondents appreciate. The information we give to users should not be presented in a boring way. Social media should have cool content, and since the installation is favoured over the website, we should really invite people to come to our installation - using the website will be the second step then. We should think about ways to make the experience of using the installation immersive and fun, making people stay at the installation and remember it for long. For this, we can use our photo campaign on social media, inviting visitors to share photos of myENSCHEDE with our hashtag #myENSCHEDE.

Comments